Thursday, April 9, 2009

04/09 - Defies bearish seasonal forces


The US Dollar Index has rebounded after failing to sustain losses below the 84.30 pivot and highlights on-going support via the 160-day MA. This has enabled a push above the mid-level threshold of MACD and a downward sloping RSI trend line. This zig-zag formation has found support from the former resistant 20-day MA, but will have to clear the bull-bear 50% retracement zone at the 86 handle to further defy bearish seasonal forces. A sustained loss of the 100-day MA should re-open key 160-day MA support then the 200-day MA.
{STRATEGY} LOOK TO SELL (BUY EUR/USD)
Thursday, April 2, 2009

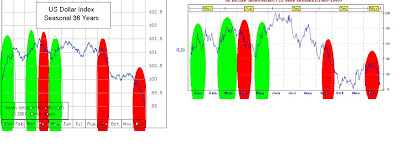
04/02: April seasonal patterns


The month of April has historically been unkind to the US Dollar Index. Over the past seven years, the Greenback has seen gains in April only twice, both times were supported by either Fed tightening, hawkish rate expectations or both. Both seasonal charts shows that on average, the dollar tends to fall throughout the month then bottom out in early May. April also tends to be one of the strongest seasonal months for the DJIA and S&P, both of which have had strong inverse correlations with the US Dollar Index. These seasonal factors alone suggest that a sustained loss of 84.30 (former consolidative resistance) will enable the dollar to test the key 200-day MA.

STRATEGY: SELL USD's