Friday, August 21, 2009

08/21 - DXY probes key Fib


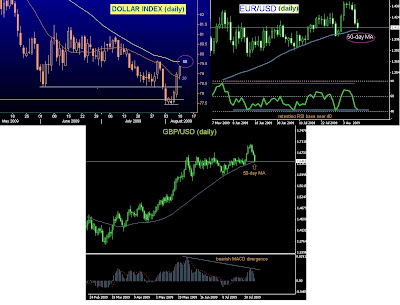
The US Dollar Index rejected at a 5-month downward sloping trendline and at the key 50-day moving average earlier in the week and has struggled going into Friday's close. A strong rebound in commodities and equities has forced the DXY back towards a key Fib at 77.93 (61.8% of 70.69-89.62). While 4-hourly studies are at oversold levels, daily indicators suggest plenty of room to test 77.45, near the December 2008 swing low and the recent lows made in early August. Moreover, according to seasonal charts the Greenback historically fares poorly after mid-August into the second half of the year. The EUR/USD rebounded from oversold RSI levels after briefly probing below the 50-day MA. The sustained clearance of the June pivot at 1.4327 should expose the recent high at 1.4448 ahead of a possible extension towards 1.4600.
The major US equity indices failed to retreat further than 2 days once again. As a result, previous resistance was wiped out. The trend is clearly intact until the major averages can sustain a counter-trend correction beyond 2 days. The next upside target for the S&P 500 resides in the 1048 region, where an important Fibonacci extension and pivot coincide.

Friday, August 14, 2009

08/14 - Chart of the week


The three major US equity indices have all stalled at key technical levels. The S&P 500 has paused at 1013.94, the 38.2% retracement of the 2007 & 2009 range. The DJIA has paused at the same retracement level (at 9424.70). The Nasdaq has completed a double bottom measured move near 2010 and has consolidated just below it over the past few sessions. While it may be premature to call a top, a correction is in store as these key resistance levels remain intact. The counter-rallies have been brief, mostly limited to 2 down days before finding a higher level of support. Thus, one way to gauge market strength will be to see whether Friday's retreat can extend through Tuesday, more than just a 2-day correction. If equities manage to rebound, however, there is a substantial probability that these equity indices will race to new highs.

Thursday, August 13, 2009

08/13 - EUR/USD's symmetrical exhibition


The EUR/USD continues to respect 1.4227, the 50% retracement level of the 2008 highs & 2009 lows. Two weeks ago, the pair retraced 50% below this level, then 50% above the following week. Wednesday's rebound coincided with a 23.6% retracement below the 1.4227 pivot and Thursday's high rejected near 1.4312, 23.6% retracement above 1.4227. The symmetry exhibited suggests that despite last week's brief breakout, the EUR/USD should retest the region below 1.4227 relatively soon. Meanwhile, the DXY is probing the June pivot low of 78.31 since putting in a 3-day double top. A higher base is sought to take out the resistant 35-day exponential moving average.


Tuesday, August 11, 2009

08/11 - The big picture


The US Dollar Index is consolidating near the 78.6% retracement of the latest downleg, a key last stop ahead a probable full retracement. The DXY is probing the 35-day exponential moving average after a succesful defense of 78.20, a 61.8% retracement. Above the 50-day MA is the 50% retracement at 80.40, while below 78.79 (61.8% of 77.42-79.64) will delay the current recovery for the 10-day MA at 78.51.

The EUR/USD is consolidating above the 50-day MA since rejecting at the 50% pivot retracement at 1.4217. This bearish rejection and the emergence of a possible weekly RSI double top hint of further weakness despite oversold 4-hourly studies and daily RSI. If the single currency maintains 1.4073 (50-day MA) , however, then the medium-term bullish structure remains intact.

08/11 - Position adjusted


Monday, August 10, 2009

08/10 - GBP/USD tests the 50-day MA


The US Dollar Index has continued to rally after marking a short-term double bottom last week. The disconnect with the tight correlation between risk appetite and dollar weakness has put an emphasis on the importance of interest rate differentials. The BOE's announcement to increase quantitative easing followed by a stronger-than-expected non-farm payrolls report has enabled the the interest rate differential between 10-year (UK ) Gilts and 10-year (US) Treasuries to shrink from a 32 basis point advantage to a +11 differential. The GBP/USD's weakness highlights bearish MACD divergence and has triggered the latest probe of the key 50-day moving average. A sustained loss of 1.6430 (50-day MA) exposes the 1.6000 region and will signal a medium-term shift in trend. Meanwhile, the DXY and EUR/USD are approaching their 50-day MA's and should be tested if the Cable continues to retreat.


Thursday, August 6, 2009

08/06 - DXY confirms hourly double bottom


The US Dollar Index has confirmed an hourly double bottom just below the December 2008 spike low while the EUR/USD confirms a double top. The measured move objective for both formations coincide with a 38.2% retracement and the 10-day MA. It may offer an attractive entry point for dollar bears and could possibly mark a throw-back off a EUR/USD 2-month internal trendline. Meanwhile, since the DXY trades below the 10-day MA, there remains a chance for a panic-type sell-off towards 75.00/76.00 (near 78.6% retrace/Q3 2008 base) if this week's double bottom is cleanly lost.

08/06 - Position/orders adjusted


Wednesday, August 5, 2009

08/05 - DXY stabilizes as stocks distribute


The US Dollar Index has managed to stabilize as equity markets finally put in an overdue distribution day. The S&P and Dow Jones Industrial Average both broke below rising wedge support on Tuesday on stronger volume to possibly hint of a short-term correction. Meanwhile, the DXY continues to consolidate near the December 2008 low, but remains well below key moving averages (10 & 20-day MA's). 4-hourly studies suggest temporary basing, but will require a move above 77.85 (Tuesday's high) to confirm a near-term double bottom. Below this week's lows at 77.43/45 could trigger a panic sell-off towards 75.00/76.00 (near 78.6% retrace/Q3 2008 base). If equity markets continue to correct, however, the Greenback should receive a well-deserved boost and revisit last week's pivot (78.22/30).

08/05 - USD/CAD revised buy strategy


Tuesday, August 4, 2009

08/04 - Loonie's possible wedge formation


The USD/CAD weakened Tuesday on the back of comments regarding excessive currency appreciation. Bullish 4-hourly MACD divergence invoked a corrective rebound that has since stalled near last week's swing low at 1.0740. It appears that this pair may be forming a falling wedge, typically a reversal pattern. A relatively low risk entry point would be 1.0583, where wedge support and a key fibonacci retracement coincide. Meanwhile, the bearish structure remains intact while the Loonie trades below the 10-day MA (now at 1.0829) and a clean loss of 1.0583 could trigger a capitulation-type move towards the 1.04 region.

Monday, August 3, 2009

08/03 - DXY slammed to fresh 10 month lows


The US Dollar Index has fallen to a fresh 10-month low as risk appetite continues to flourish. Last week's rejection at a key fibonacci retracement and the 20-day moving average hinted that the brief recovery was about to end. The Cable's (GBP/USD) subsequent ascending triangle breakout triggered further losses, causing the Greenback to fall back towards the once hopeful double bottom base. Monday's follow-through has been tempered by demand near the December 2008 spike low. The obvious support at 77.64 could allow for a pullback back towards last week's base at 78.22/30, which would present a good opportunity to short. A capitulation-type move could be at play towards 75.00/76.00 (near 78.6% retrace/Q3 2008 base) until the 10-day MA is broken to the upside.
The EUR/USD found support at a key fibonacci retracement and the 50-day MA last week to establish a fresh 2009 high on Monday. The brief relapse tested the top-end of last week's 1.40-1.42 range. The ensuing rally to 1.4444 has validated the symmetrical relation to the previous 400 pip range and represents a 61.8% extension. The 78.6% proportion comes in at 1.4514 and the equality range target or 100% proportion is 1.46. This level is also the 61.8% retracement pivot of the 2008 high & lows and should provide decent resistance since both the 38.2% and 50% levels acted as very relevant pivots. A pullback to the 1.4289 region would be the third test of a two-month internal trendline and would be an attractive long entry point. Meanwhile, the medium-term bullish structure remains intact while this pair trades above key weekly RSI pivots and the 50-day MA.


08/03 - USD/CAD stopped out